
Advanced Stock Backtesting in Python (Parameter Grid Search with FLAML Library)
and Backtesting.py

This tutorial shows you how to enhance your stock trading backtesting strategies using Python and the FLAML library's (Fast Library for Automated Machine Learning) powerful parameter grid search optimization techniques. It covers how to leverage Continuous Frugal Optimization (CFO) to simplify and accelerates the search for the most profitable historical simple moving average crossovers, which can save significant time and computational resources. It also shows how to integrate the popular backtesting.py backtest python library with the FLAML library.
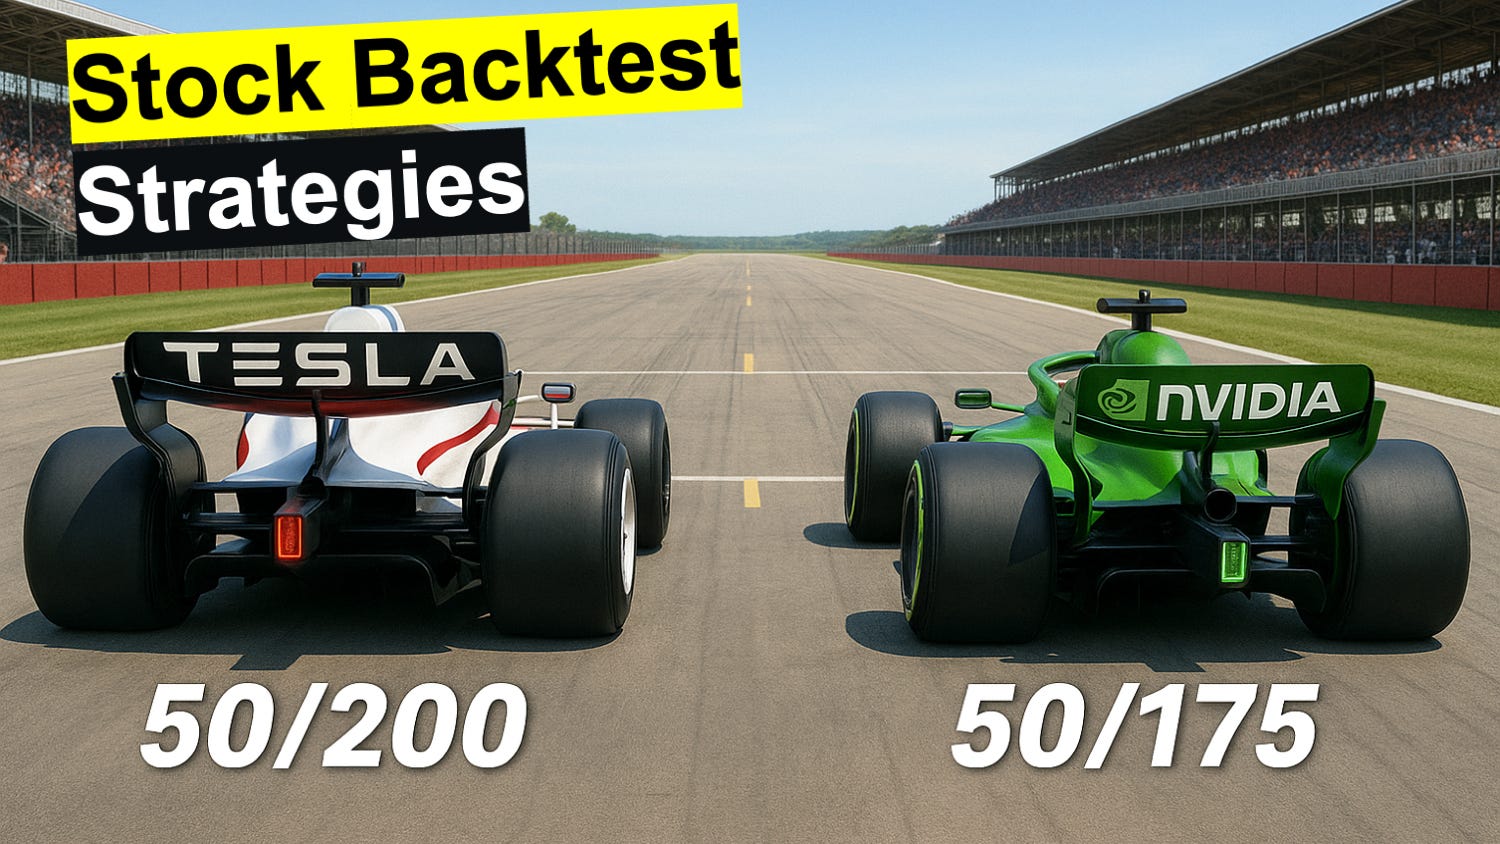
The tutorial covers how going beyond the popular 50/200 fast/slow "Golden Cross" can sometimes lead to improvement in historical performance. This is for anyone interested in stock trading from casual investors and traders to quant finance analysts seeking actionable insights through cutting-edge Python methods.
Importantly, you can use this parameter grid search strategy to test more than just simple moving average crossovers, but any other Sharpe ratio producing strategy.
Important Note: This video is for informational & educational purposes only. It shows how to analyze past, historical stock performance. It is not for investment, trading, financial, or tax advice. Past performance does not equal future performance.
Want to do AI-Powered Technical Analysis directly inside of Google Sheets?
Check out the FREE AI for Charts Google Sheets Add On: aiforcharts.com

Environment Setup
Code (Scripts 1 & 2)
# Script 1

# Stock CFO Grid Search Backtester
## Imports
# FIRST RUN ONLY →  pip install flaml backtesting pandas numpy pandas_datareader seaborn matplotlib
import math
import pandas as pd
import numpy as np
import seaborn as sns
import matplotlib.pyplot as plt
from pandas_datareader.data import DataReader
from flaml import tune
from backtesting import Backtest, Strategy

## Settings
HORIZON     = 126                     # ≈ half year
START       = "2015-01-01"
TICKERS     = ["AAPL","MSFT","GOOGL","AMZN","META","NVDA","TSLA"]

SEARCH      = {"fast": tune.randint(20,81), "gap": tune.randint(60,241)} #Slow: 81-320
BASELINE    = {"fast": 50, "gap": 150}       # classic 50/200

BUDGET_SEC  = 30                      # optimiser time-budget per ticker
SEARCH_ALG  = "CFO"                  # "CFO" or "RandomSearch", etc.

SIZE_FAC    = 600                            # bubble-size scale (charting)
## Helpers
def fetch(tkr: str) -> pd.DataFrame:
    """Download OHLC from Stooq and ensure Open/High/Low columns exist."""
    df = DataReader(tkr, "stooq", START).sort_index()
    for col in ("Open", "High", "Low"):
        if col not in df.columns:
            df[col] = df["Close"]
    return df.dropna(subset=["Close"])

def q_sharpe(stats: dict) -> float:
    """Backtesting.py Sharpe (ann.) → 126-day Sharpe."""
    return stats["Sharpe Ratio"] / math.sqrt(252 / HORIZON)
### Backtesting Strategy
class CrossHold(Strategy):
    fast, slow, hold = 50, 200, HORIZON
    def init(self):
        c = self.data.Close
        roll = lambda n: pd.Series(c).rolling(n).mean().values
        self.fma = self.I(lambda x: roll(self.fast), c)
        self.sma = self.I(lambda x: roll(self.slow), c)
        self.held = 0
    def next(self):
        if self.position:
            self.held += 1
            if self.held >= self.hold:
                self.position.close()
        elif self.fma[-2] < self.sma[-2] and self.fma[-1] > self.sma[-1]:
            self.buy(); self.held = 0
## FLAML Optimization
def best_params(df: pd.DataFrame, budget=BUDGET_SEC, alg=SEARCH_ALG):
    def objective(cfg):
        f = int(cfg["fast"])
        s = f + int(cfg["gap"])
        stats = Backtest(df, CrossHold, cash=1e6).run(fast=f, slow=s)
        return {"sharpe": q_sharpe(stats)}
    analysis = tune.run(objective,
                        config=SEARCH,
                        metric="sharpe",
                        mode="max",
                        time_budget_s=budget,
                        search_alg=alg,
                        points_to_evaluate=[BASELINE],
                        num_samples=-1,
                        verbose=0)
    b = analysis.best_config
    return b["fast"], b["fast"]+b["gap"], analysis.best_result["sharpe"], analysis
## Main Loop
print("\nQuarter-Sharpe of latest 126-day hold after SMA cross-up\n")
frames = []                               # for plot
for tkr in TICKERS:
    df = fetch(tkr)
    f_opt, s_opt, q_opt, analysis = best_params(df)
    q_base = q_sharpe(Backtest(df, CrossHold).run(fast=50, slow=200))
    print(f"{tkr:5}: best {f_opt:>2}/{s_opt:<3}  Q-Sharpe {q_opt:5.2f} | "
          f"50/200 {q_base:5.2f} | Δ {q_opt-q_base:+.2f}")

    # ─ store ALL trials (for background bubbles) ─
    trials = pd.DataFrame(analysis.results.values())
    trials["fast"]  = trials["config/fast"].astype(int)
    trials["slow"]  = trials["fast"] + trials["config/gap"].astype(int)
    trials["sharpe"]= trials["sharpe"].replace(-np.inf, np.nan)
    trials["ticker"]= tkr; trials["is_base"] = False

    # baseline point
    baseline_row = pd.DataFrame({"fast":[50],"slow":[200],"sharpe":[q_base],
                                 "ticker":[tkr],"is_base":[True]})
    frames.append(pd.concat([trials, baseline_row], ignore_index=True))

## Visualization
big = pd.concat(frames, ignore_index=True)

sns.set_style("darkgrid")
sizes = (big["sharpe"].clip(lower=0).fillna(0)+0.01) * SIZE_FAC

rel = sns.relplot(data=big[~big["is_base"]], x="fast", y="slow",
                  size=sizes[~big["is_base"]], hue="sharpe",
                  palette="viridis", col="ticker", col_wrap=3,
                  height=3.5, aspect=1, legend=False, alpha=0.5)

for ax, tkr in zip(rel.axes.flat, TICKERS):
    pts  = big.query("ticker == @tkr and ~is_base")
    base = big.query("ticker == @tkr and  is_base")
    best = pts.loc[pts["sharpe"].idxmax()]
    # best in black
    ax.scatter(best["fast"], best["slow"], marker="*", s=180,
               color="black", zorder=6)
    ax.text(best["fast"]+1, best["slow"]+1,
            f"best {best['fast']}/{best['slow']:.0f}", color="black", fontsize=7)
    # baseline 50/200 in red
    ax.scatter(base["fast"], base["slow"], marker="*", s=150,
               color="red", zorder=5)
    ax.text(base["fast"].item()+1, base["slow"].item()+1,
            "50/200", color="red", fontsize=7)
    ax.set_xlim(20, 80); ax.set_ylim(80, 320)

rel.set_titles(col_template="{col_name}")
rel.set_axis_labels("Fast MA length", "Slow MA length")
plt.tight_layout(); plt.show()# Script 2
# Entire Dow Jones Industrial Average Index
# ---------------------------------------------------------------
# Dow-30 | best fast/slow SMA cross-ups (CFO search, 126-day hold)
# ---------------------------------------------------------------
import math, warnings, pandas as pd, numpy as np, seaborn as sns, matplotlib.pyplot as plt
from pandas_datareader.data import DataReader
from backtesting import Backtest, Strategy
from flaml import tune
warnings.filterwarnings("ignore", category=FutureWarning)
# ───────── settings ─────────
HORIZON = 126 # hold ≈ half-year
START = "2015-01-01"
DJIA = ["AAPL","AMGN","AXP","BA","CAT","CRM","CSCO","CVX","DIS","DOW",
"GS","HD","HON","IBM","INTC","JNJ","JPM","KO","MCD","MMM",
"MRK","MSFT","NKE","PG","TRV","UNH","V","VZ","WBA","WMT"]
SEARCH = {"fast": tune.randint(20,81), "gap": tune.randint(60,241)}
BASELINE = {"fast": 50, "gap": 150} # classic 50/200
BUDGET_SEC = 30 # optimiser budget per ticker
SEARCH_ALG = "CFO" # keep CFO
SIZE_FAC = 900 # bubble scale (single plot)
# ───────── helpers ─────────
def fetch(tkr:str) -> pd.DataFrame:
df = DataReader(tkr, "stooq", START).sort_index()
for col in ("Open","High","Low"):
if col not in df.columns:
df[col] = df["Close"]
return df.dropna(subset=["Close"])
def q_sharpe(stats:dict) -> float:
return stats["Sharpe Ratio"] / math.sqrt(252 / HORIZON)
# ───────── strategy ─────────
class CrossHold(Strategy):
fast, slow, hold = 50, 200, HORIZON
def init(self):
c = self.data.Close
roll = lambda n: pd.Series(c).rolling(n).mean().values
self.fma = self.I(lambda x: roll(self.fast), c)
self.sma = self.I(lambda x: roll(self.slow), c)
self.held = 0
def next(self):
if self.position:
self.held += 1
if self.held >= self.hold:
self.position.close()
elif self.fma[-2] < self.sma[-2] and self.fma[-1] > self.sma[-1]:
self.buy(); self.held = 0
# ───────── FLAML wrapper ─────────
def best_params(df:pd.DataFrame, *, budget=BUDGET_SEC, alg=SEARCH_ALG):
def objective(cfg):
f = int(cfg["fast"]); s = f + int(cfg["gap"])
stats = Backtest(df, CrossHold, cash=1e6).run(fast=f, slow=s)
return {"sharpe": q_sharpe(stats)}
ana = tune.run(objective,
config=SEARCH,
metric="sharpe", mode="max",
time_budget_s=budget,
search_alg=alg,
points_to_evaluate=[BASELINE],
num_samples=-1, verbose=0)
b = ana.best_config
return b["fast"], b["fast"]+b["gap"], ana.best_result["sharpe"]
# ───────── optimisation loop ─────────
rows = []
print("\nQuarter-Sharpe of most-recent 126-day hold after SMA cross-up\n")
for tkr in DJIA:
try:
df = fetch(tkr)
f,s,q = best_params(df)
q50 = q_sharpe(Backtest(df, CrossHold).run(fast=50, slow=200))
print(f"{tkr:4}: best {f:>2}/{s:<3} Q-Sharpe {q:5.2f} | 50/200 {q50:5.2f} | Δ {q-q50:+.2f}")
rows.append({"ticker":tkr,"fast":f,"slow":s,"sharpe":q})
except Exception as e:
print(f"{tkr}: skipped ({e})")
best_df = pd.DataFrame(rows)
# ───────── bubble chart ─────────
sns.set_style("darkgrid")
fig, ax = plt.subplots(figsize=(9,7))
size = (best_df["sharpe"].clip(lower=0)+0.01)*SIZE_FAC
sc = ax.scatter(best_df["fast"], best_df["slow"],
s=size, c=best_df["sharpe"],
cmap="viridis", alpha=.6, edgecolor="k")
for _, r in best_df.iterrows():
ax.text(r["fast"]+0.7, r["slow"]+0.7, r["ticker"], fontsize=8, weight="bold")
# baseline and average markers
ax.scatter(50, 200, marker="*", s=250, color="red", zorder=5)
ax.text(51.5, 206, "50/200 baseline", color="red", fontsize=9)
avg_f, avg_s = best_df["fast"].mean(), best_df["slow"].mean()
ax.scatter(avg_f, avg_s, marker="*", s=280, color="black", zorder=6)
ax.text(avg_f+1.5, avg_s+1.5, f"avg {avg_f:.1f}/{avg_s:.1f}", color="black", fontsize=9)
ax.set_xlim(20,80); ax.set_ylim(80,320)
ax.set_xlabel("Fast MA length"); ax.set_ylabel("Slow MA length")
ax.set_title("Dow-30: best SMA cross-up parameters (126-day hold, CFO search)")
fig.colorbar(sc, ax=ax, label="Quarter-Sharpe")
plt.tight_layout(); plt.show()Learn more about AI for Charts: aiforcharts.com
Subscribe to the Deep Charts YouTube Channel for more informative AI and Machine Learning Tutorials.