
Build a Custom ETF with AI (Python Tutorial)
Perplexity Sonar Web Search + Streamlit

This video shows you how to build a conceptual AI-generated thematic ETF in Python and run a simplified backtest of it against the S&P 500 index. The tutorial shows you how to search for companies within niche subsectors of the economy with Perplexity Sonar through the OpenAI Python library, as well as how to pull financial stock data from Stooq.
Because the portfolio is assembled with today’s information, the backtest contains look-ahead and survivorship bias, meaning historical results will look better than what was likely attainable in real time. Treat the dashboard as an idea-discovery tool, not investment or financial advice, and explore how different prompts and shorter look-back windows affect the simulated performance.
Important Disclaimer: This tutorial is for informational and educational purposes only. It does NOT provide financial, investment, trading, or any other professional advice. Past performance is NOT a guarantee or predictor of future actual trading results. You are solely responsible for your trading decisions.
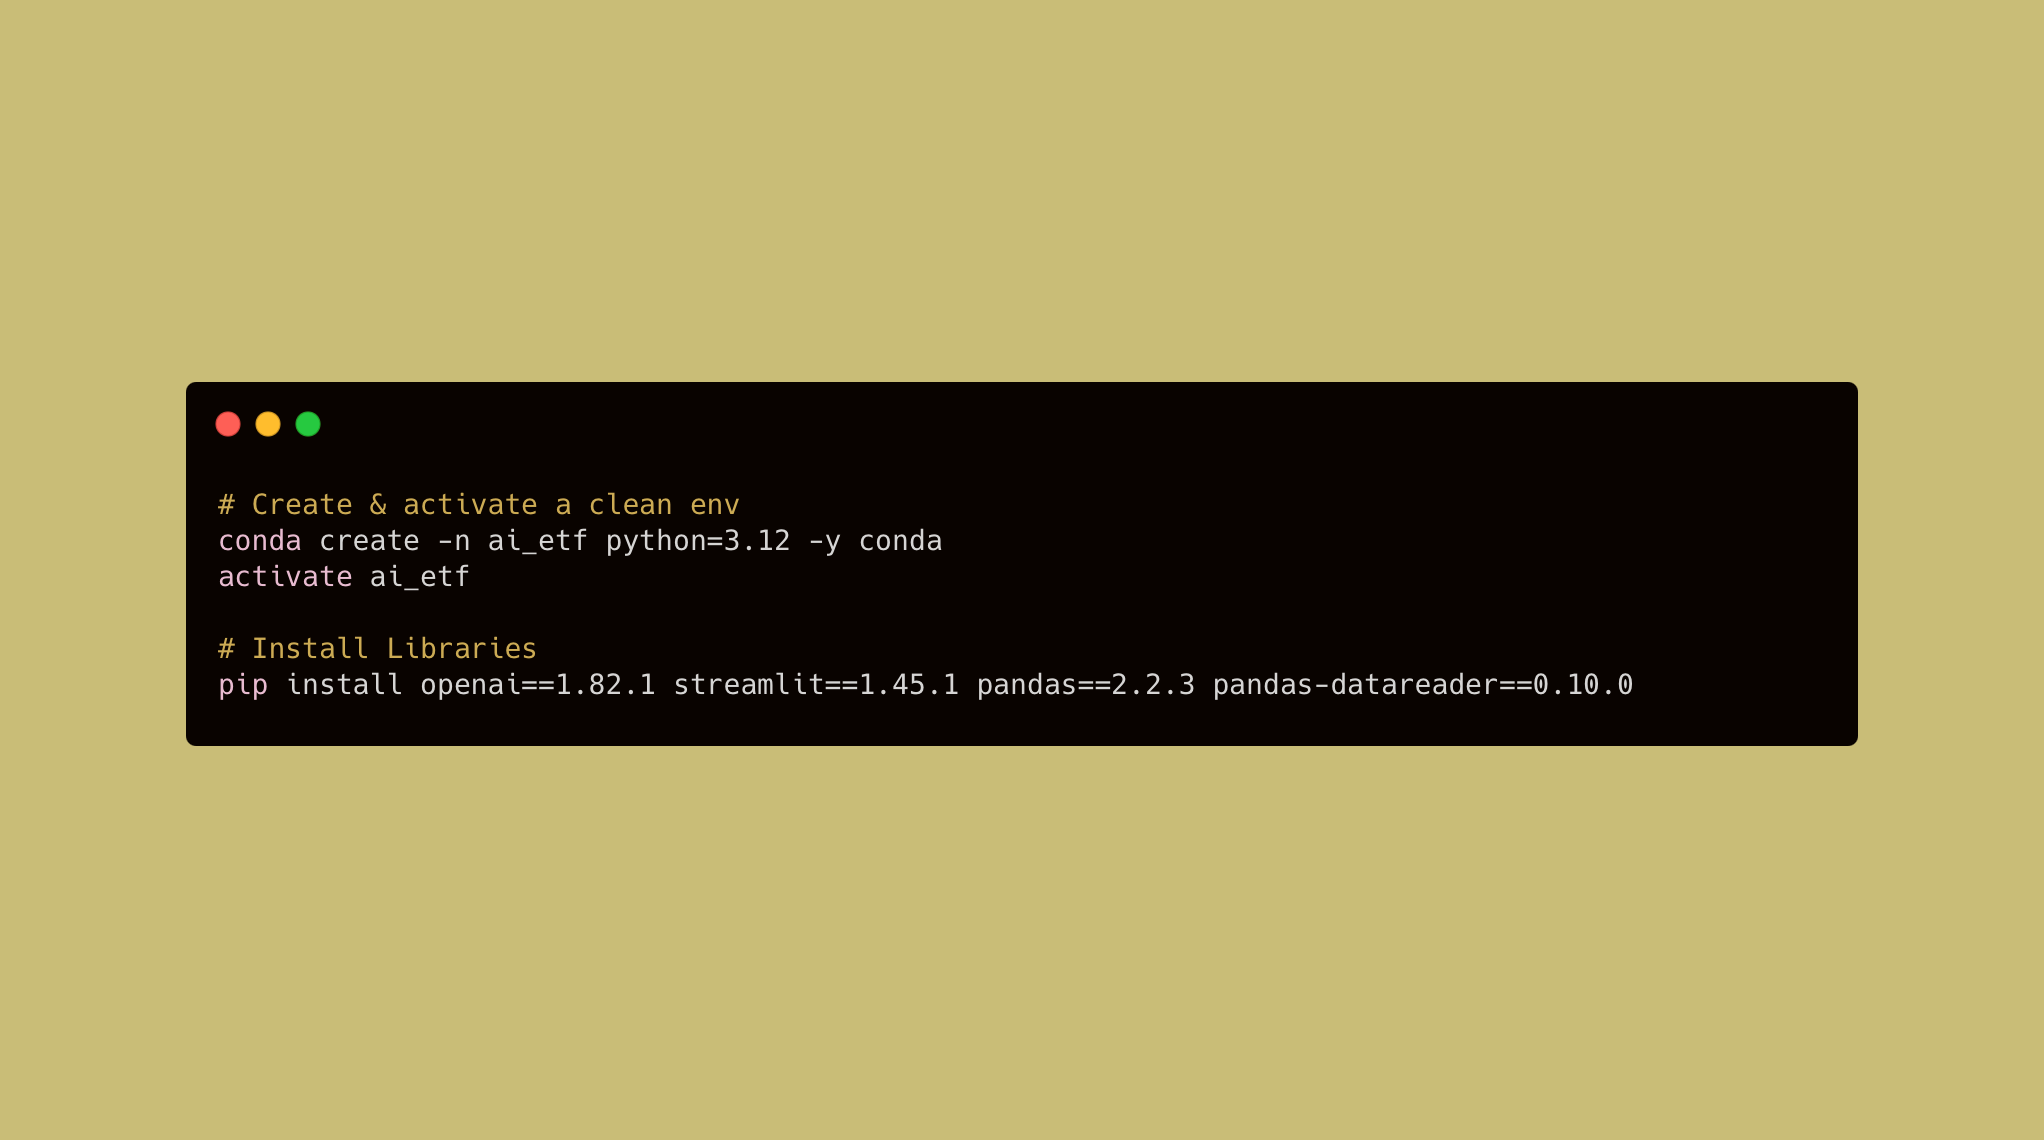
ENVIRONMENT
CODE
# AI ETF + Backtest Streamlit Dashboard

# Libraries and Modules
from openai import OpenAI
import streamlit as st
import pandas as pd
from pandas_datareader.data import DataReader
import os
import re
import json
import datetime as dt

# CONFIG
KEY = os.getenv("API_KEY") or st.secrets.get("API_KEY", "")
if not KEY:
    st.error("Please set API_KEY first")
    st.stop()

client = OpenAI(api_key=KEY, base_url="https://api.perplexity.ai")

# FUNCTIONS
def get_tickers(theme: str, n: int) -> list[dict]:
    """Ask perplexity sonar for <ticker,name> pairs and return a list of dicts."""
    prompt = (
        f"Return JSON {{'companies':[{{'ticker':'','name':''}},…]}} with {n} "
        f"liquid US‑listed operating companies whose main business fits \"{theme}\". "
        "These should be the top N companies in this industry. "
        "Exclude ETFs, funds, trusts, index products. Tickers only. Respond JSON only."
    )
    raw = client.chat.completions.create(
        model="sonar-pro",
        messages=[{"role":"user","content":prompt}]
    ).choices[0].message.content
    data = json.loads(re.search(r"\{.*\}", raw, re.S).group())
    return data["companies"][:n]


def fetch_prices(tickers: list[str], months: int) -> pd.DataFrame:
    """Pull Close prices from Stooq and return a DataFrame(date × ticker)."""
    start = (dt.date.today() - dt.timedelta(days=months*30)).isoformat()
    prices = {}
    for t in tickers:
        try:
            df = DataReader(t, "stooq", start)
            if "Close" in df:
                prices[t] = df["Close"].iloc[::-1]
        except Exception:
            pass
    return pd.DataFrame(prices)

# STREAMLIT UI
st.title("📈 AI ETF Creator")

with st.sidebar:
    theme  = st.text_input("ETF theme", "Space Exploration")
    months = st.slider("Look‑back (months)", 1, 12, 6)
    count  = st.number_input("Stocks", 1, 20, 10, step=1)
    run    = st.button("Build ETF", type="primary")

if run:
    comps   = get_tickers(theme, count)
    tickers = [c["ticker"].upper() for c in comps]

    price_df = fetch_prices(tickers, months)
    if price_df.empty:
        st.error("No Stooq data — try another theme")
        st.stop()

    w   = 1/price_df.shape[1]
    etf = (price_df.pct_change().dropna()*w).sum(axis=1).add(1).cumprod()
    spx = DataReader("^SPX", "stooq", price_df.index[0])["Close"].iloc[::-1]
    spx = spx.reindex(etf.index).ffill()/spx.iloc[0]

    st.line_chart(pd.DataFrame({f"{theme} ETF": etf, "S&P 500": spx}))

    comp_df = pd.DataFrame(comps)[["ticker","name"]].rename(columns={"ticker":"Ticker","name":"Company"})
    st.dataframe(comp_df, hide_index=True)
    st.download_button("Download CSV", comp_df.to_csv(index=False).encode(), "etf.csv")

st.caption("Educational demo only, not investment advice.")
Thanks for reading the Deep Charts Substack. Check out my new Google Sheets add-on that lets you do historical stock backtest simulations directly in Google Sheets: Stock Backtester for Google Sheets™
Subscribe to the Deep Charts YouTube Channel for more informative AI and Machine Learning Tutorials.
The code was working a few months ago. I just try to run it again I got error message in Streamlit. Can you take a look? Thx thx.