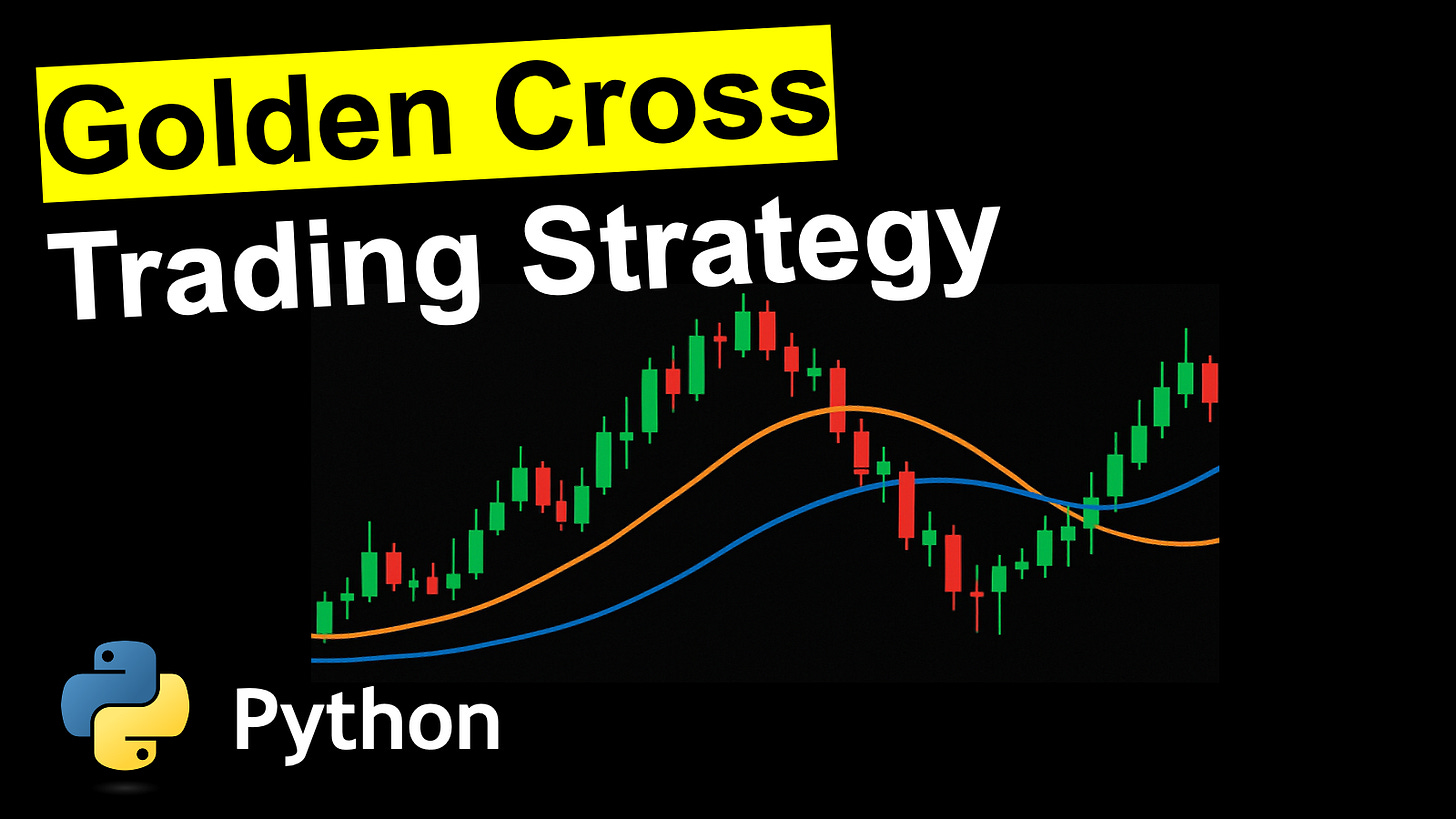
Golden Cross Trading Strategy with Python:
Detect Stock Moving Average Crossovers Programmatically
This tutorial demonstrates how to programmatically identify recent "Golden Cross" technical chart patterns in Python for all tickers within the S&P 500 index. I cover how to pull daily stock prices from Google Finance into Python via Google Sheets, how to calculate the 50-day and 200-day simple moving averages using pandas, and how to systematically detect stocks showing bullish crossovers, which are a widely known technical analysis pattern.
The script is fully customizable for different use cases. It's easily adaptable for larger watchlists, automated alerts with Cron jobs, and even algorithmic trading setups.
Important Note: This video is for informational & educational purposes only. It shows how to analyze past, historical stock performance. It is not for investment, trading, financial, or tax advice. Past performance does not equal future performance.
Want to do AI-Powered Technical Analysis directly inside of Google Sheets?
Check out the FREE AI for Charts Google Sheets Add On: aiforcharts.com
Google Sheets S&P 500 Auto-Refresh Data:
https://docs.google.com/spreadsheets/d/1MdrNeShdcFYWdQiPxVZH4-DZI8wQK5rrTCpSz-IxpyA/edit?usp=sharing
Code:
import pandas as pd
from datetime import timedelta

## Google Sheet with past 350 days of Close Price of S&P 500 Tickers
# https://docs.google.com/spreadsheets/d/1MdrNeShdcFYWdQiPxVZH4-DZI8wQK5rrTCpSz-IxpyA/edit?usp=sharing

SHEET_ID  = "1MdrNeShdcFYWdQiPxVZH4-DZI8wQK5rrTCpSz-IxpyA"
TAB       = "Data"
FAST, SLOW = 50, 200
WINDOW_D   = 7

url  = f"https://docs.google.com/spreadsheets/d/{SHEET_ID}/gviz/tq?tqx=out:csv&sheet={TAB}"
raw = pd.read_csv(url, na_values=["#N/A"])

raw.rename(columns={raw.columns[0]: "Date"}, inplace=True)
raw["Date"] = pd.to_datetime(raw["Date"], errors="coerce")
raw = raw.dropna(subset=["Date"])

prices = (raw.set_index("Date")
             .apply(pd.to_numeric, errors="coerce")
             .dropna(axis=1, how="all")
             .sort_index()
             .ffill())                              # ← fill gaps

fast   = prices.rolling(FAST).mean()
slow   = prices.rolling(SLOW).mean()
cross  = (fast.shift(1) < slow.shift(1)) & (fast >= slow)

last   = cross.apply(lambda c: c[c].index[-1] if c.any() else pd.NaT)
cutoff = prices.index.max() - timedelta(days=WINDOW_D-1)
recent = last >= cutoff

summary = (pd.DataFrame({
            "Last Cross": last.dt.date,
            "Recent?": ["✅" if r else "" for r in recent]
          })
          .sort_values("Last Cross", ascending=False, na_position="last"))
print("\nSummary:")
summary.head(45)
Learn more about AI for Charts: aiforcharts.com
Subscribe to the Deep Charts YouTube Channel for more informative AI and Machine Learning Tutorials.


