


Spot New Quant Finance Strategies Fast: Daily ArXiv Research Feed with Ollama + Streamlit
Snipe Alpha from arXiv

This tutorial shows you how to spin up a local Streamlit dashboard that pulls the newest arXiv papers in quantitative finance and machine learning, runs them through Google's Gemma 3 open source model through Ollama on your computer, and serves one-sentence summaries right in your browser. You’ll see the whole flow that can be accomplished on Mac or Windows: installing Ollama, grabbing an open-source model, writing a 50-line Streamlit script, and launching the app. There are no cloud api keys or api fees.
The payoff is a custom research radar that keeps you current on the latest scientific breakthroughs in quant finance before they hit mainstream blogs or analyst notes. I have included a starter prompt for TL;DR summarization, but you can update the prompt to ask about the "so what?" and ask it to "describe it to me like I'm 12."
Want to do AI-Powered Technical Analysis directly inside of Google Sheets?
Check out the FREE AI for Charts Google Sheets Add On: aiforcharts.com

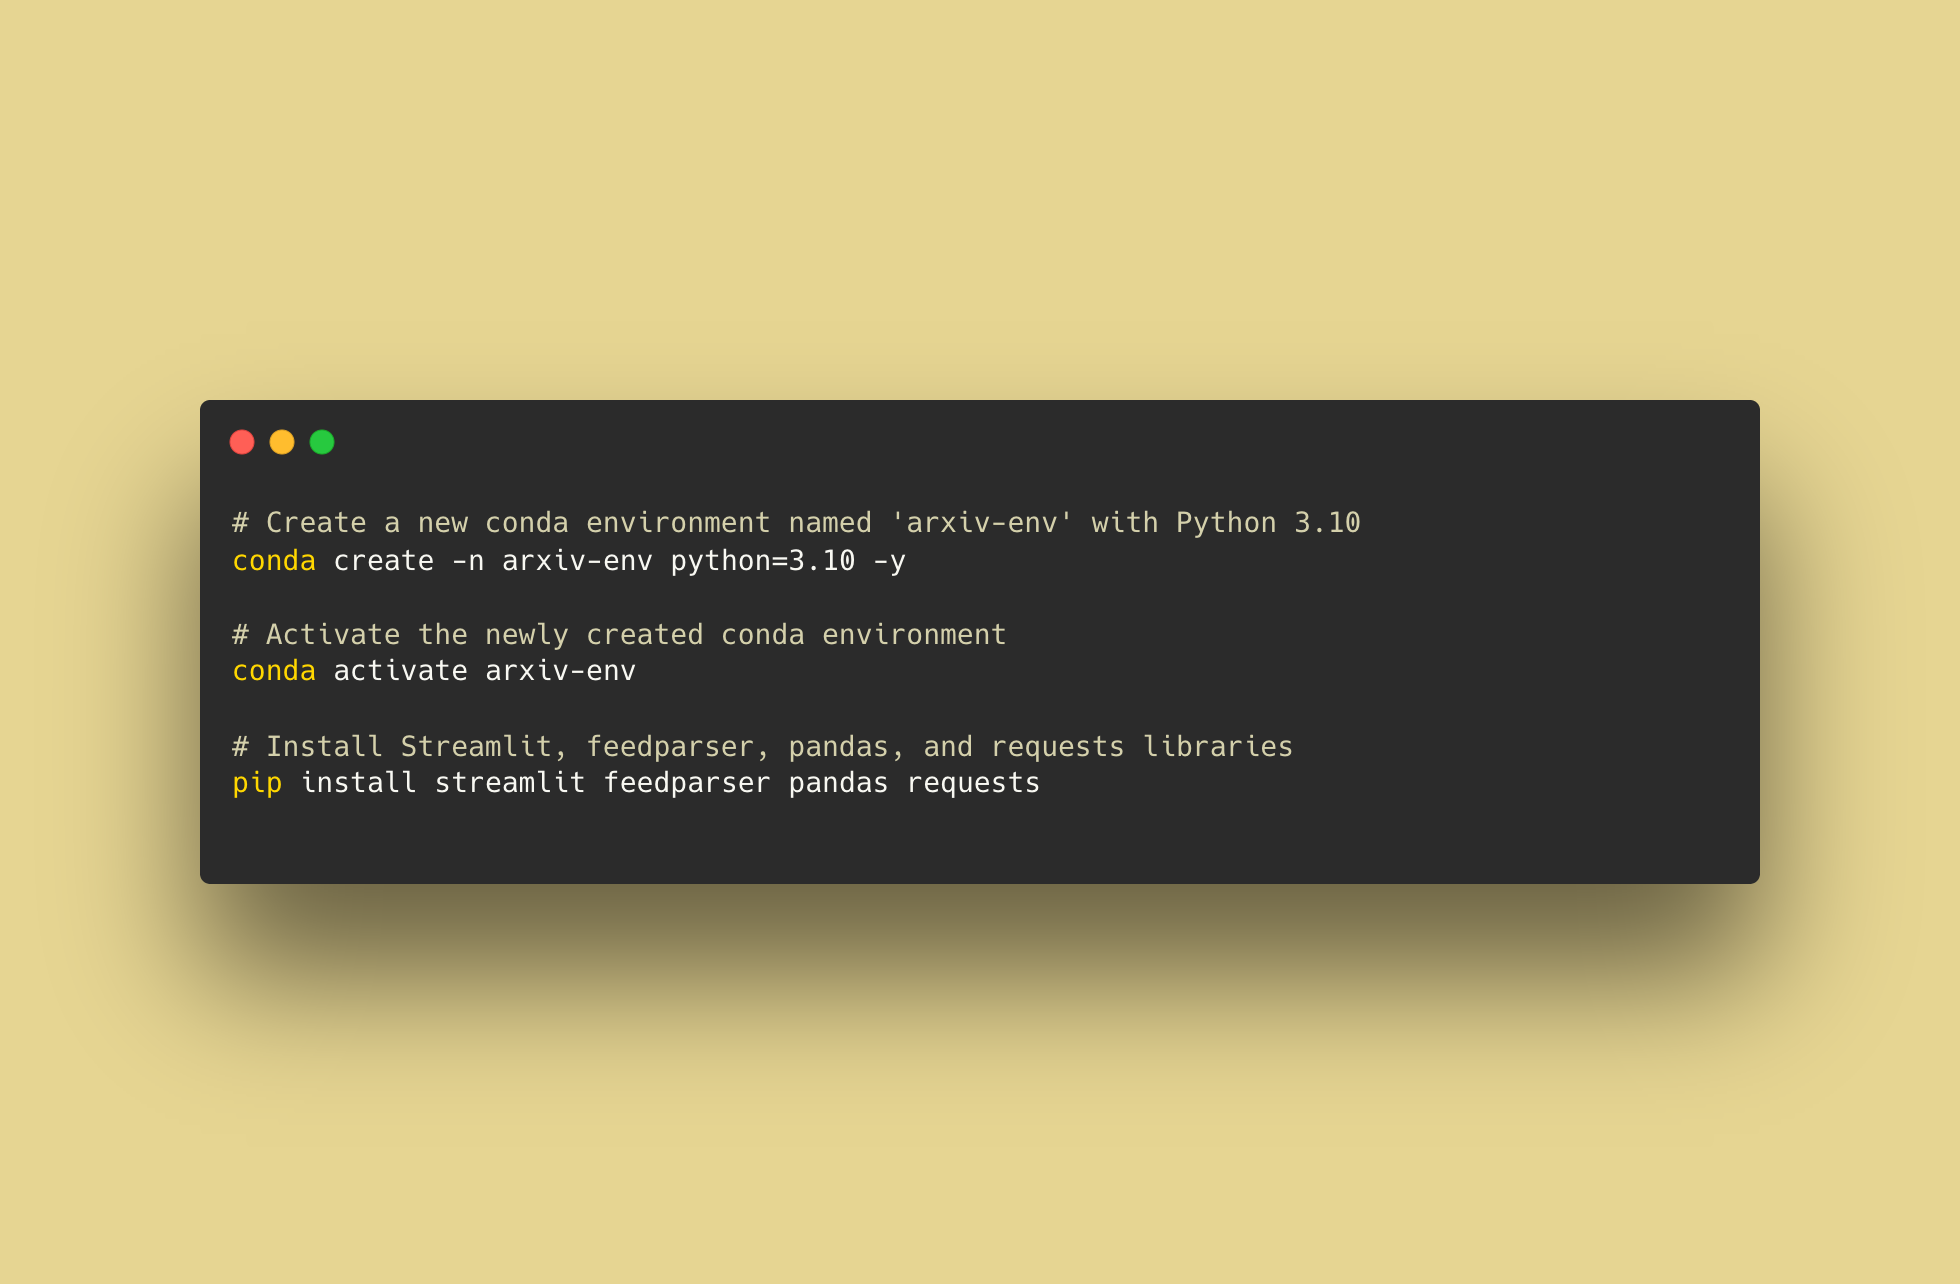
Environment Setup
Full Code
import streamlit as st
import feedparser
import pandas as pd
import requests
import time
import json

OLLAMA   = "http://localhost:11434"
MODEL    = "gemma3:1b"
RSS_MAP  = {"q-fin": "https://export.arxiv.org/rss/q-fin",
            "cs.LG": "https://export.arxiv.org/rss/cs.LG",
            "stat.ML": "https://export.arxiv.org/rss/stat.ML"}

def ollama_tldr(text:str) -> str:
    r = requests.post(f"{OLLAMA}/api/generate",
        json={"model": MODEL,
              "prompt": f"Give a one sentence of the following content, and only print that one sentence:\n{text}",
              "temperature": .3,
              "stream": False},
              timeout=120)
    r.raise_for_status()
    return r.json()["response"].strip()

@st.cache_data(ttl=3600)                    # reuse for 1 h
def fetch_papers(feeds, max_n):
    rows=[]
    for tag in feeds:
        for e in feedparser.parse(RSS_MAP[tag]).entries[:max_n]:
            abs_=e.summary.replace("\n"," ")
            rows.append({"date":e.published[:10],
                         "title":e.title,
                         "authors":", ".join(a.name for a in e.authors),
                         "link":e.link,
                         "tldr":ollama_tldr(abs_)})
            time.sleep(.1)                  # polite to Ollama
    return pd.DataFrame(rows)

st.sidebar.title("AI-Paper Radar (Ollama)")
sel = st.sidebar.multiselect("Feeds", list(RSS_MAP), ["q-fin","cs.LG"])
max_n = st.sidebar.slider("Papers per feed",10,50,25)
if st.sidebar.button("Refresh now"):
    st.cache_data.clear()

df = fetch_papers(tuple(sel), max_n)
query = st.text_input("Filter by keyword")
if query:
    df = df[df["tldr"].str.contains(query, case=False)|df["title"].str.contains(query,case=False)]

st.dataframe(df)
csv = df.to_csv(index=False, encoding="utf-8-sig")
st.download_button("⬇️  Download CSV", csv, "ai_papers.csv")

st.caption("Local summaries via Gemma 3 1B in Ollama — no cloud keys 🔒")
Learn more about AI for Charts: aiforcharts.com
Subscribe to the Deep Charts YouTube Channel for more informative AI and Machine Learning Tutorials.