


Why 1-Minute Candles Are Misleading
And why there's no clear-cut alternative...

This video discusses a statistical misunderstanding of 1-minute candle charts that is well known to institutional traders but rarely addressed publicly.
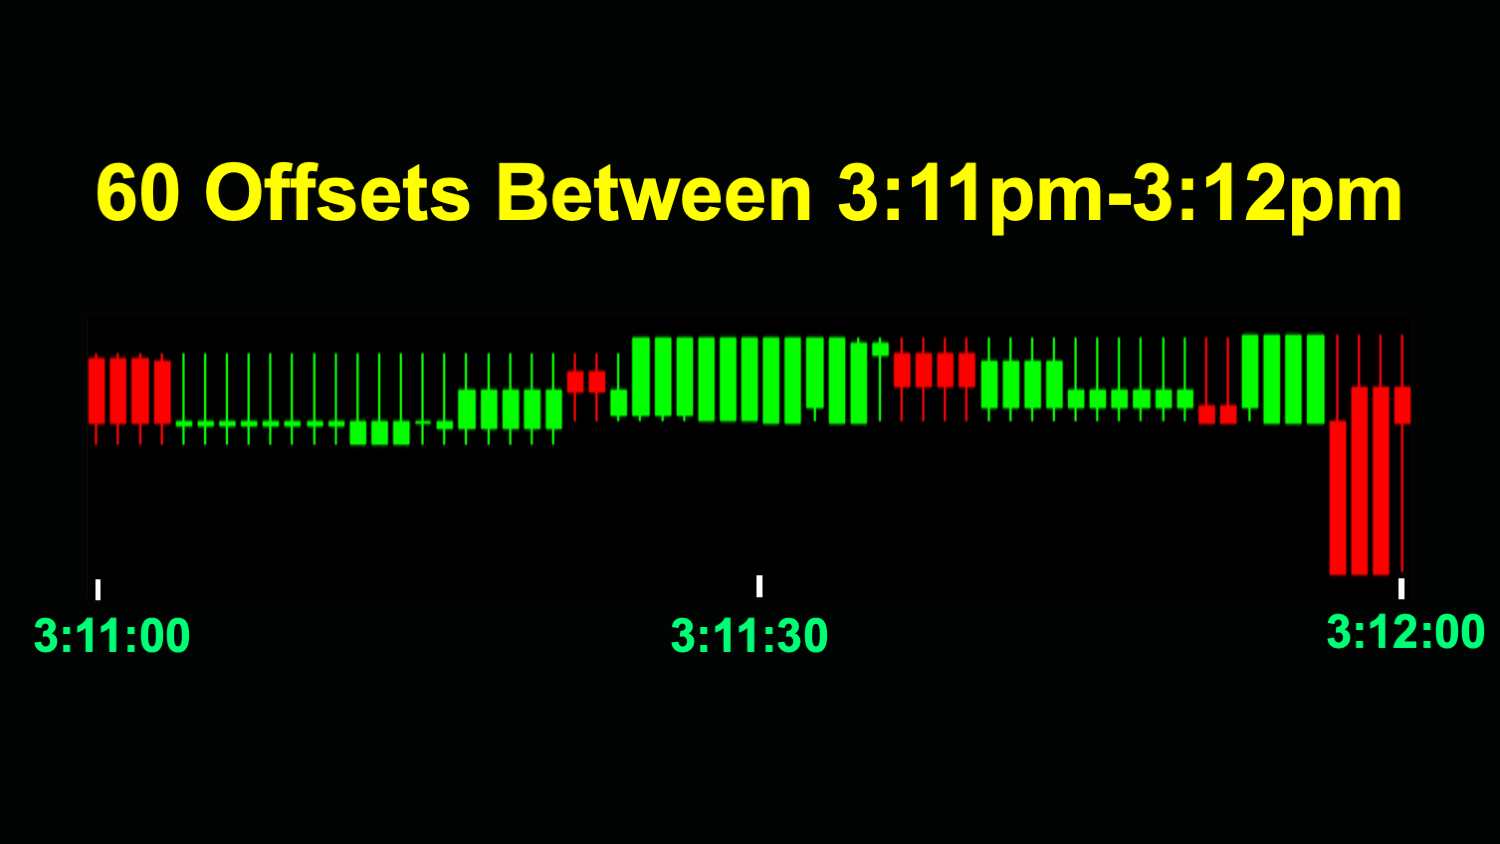
You'll learn why standard 1-minute candles can mislead traders, how shifting candle intervals by mere seconds can dramatically alter market signals, and why event-based bars, such as tick charts, or offset sampling often provide more reliable insights, but are still not clear-cut solutions.
Thanks for reading the Deep Charts Substack. Check out my new Google Sheets add-on that lets you do historical stock backtest simulations directly in Google Sheets: Stock Backtester for Google Sheets™
Subscribe to the Deep Charts YouTube Channel for more informative AI and Machine Learning Tutorials.